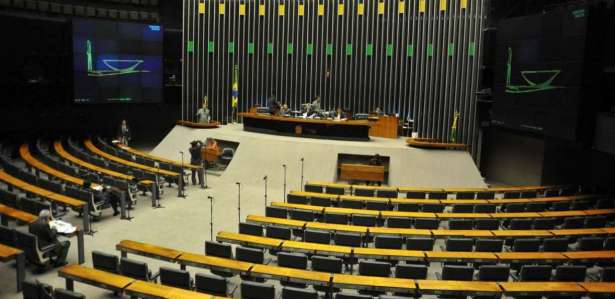
The state spends 528 times the average Brazilian’s income per parliamentarian. This is one of the conclusions of the study “How different is the Brazilian political system from that of other countries?” , signed by researchers Luciano de Castro, Odillon Camara and Sebastiao Oliveira. Compare the expenditures of 34 countries that live in a democracy. The champion in this type of expense was Brazil. “This suggests that the cost of each parliamentarian is too high for a citizen. We are a middle-income country, but we are ranked first in this comparison with economies much larger than the Brazilian economy. The problem is that the Brazilian political system works too well. It benefits itself a lot” , summarizes the professor at the Institute of Pure and Applied Mathematics (EMPA), Luciano de Castro.
>> The cost of councilors in Recife is greater than spending on health, education and sanitation in Moreno, in the metropolitan area
Argentina ranked second in the ranking, spending 228 times the average income of Argentines per parliamentarian. After that, the US pays 139 times the average US income per member of Congress. India and Mexico rank fourth and fifth with their expenditures equivalent, respectively, 112 and 103 times the average income of their citizens. With the exception of Brazil, the ratio in the 33 countries surveyed is 40 times the average income of their residents.
Also in this ranking, the owners of the lowest expenditures are: Luxembourg, Switzerland, Australia, Ireland, the United Kingdom, Sweden, Norway and Denmark. Luxembourg and Switzerland spend on average six times the income of their citizens to support members of parliament. Australia spends 10 times the average income to support legislative representatives, while in the United Kingdom and Sweden, this expenditure is 11 times the average citizen. In Norway and Denmark this figure is 12 times the average income of citizens.
It is no coincidence that the Nordic countries and the United Kingdom spend less on each parliamentarian. First, these countries have a culture of austerity in public spending. Luciano comments: “There, the politicians have no multiple advisers, no private car, no functional apartment. There are no benefits for Brazilian politicians.”
Expenditures for each parliamentarian in Brazil include a functional apartment, a working car, several advisers for each parliamentarian, allowances, which are even paid for the petrol that the parliamentarian uses in his car, phones, etc. Thus, in 2020, the budgets of the House of Representatives and the Senate, respectively, amounted to 6.7 billion Brazilian reals and 4.9 billion Brazilian reals.
Calculation
To calculate budget data by parliamentarians, the researchers calculated the total budget allocated to the federal legislative branch of each state in the sample and divided it by the number of MPs in the respective states. Then they divided the result by the state’s median income. Brazil provided an annual budget for each parliament of 5 million US dollars (about 24.7 million Brazilian reals), while the average income of the population was 9,500 US dollars (46,943 Brazilian reals). Average income included the earnings of all Brazilians divided by the number of citizens.
“Our article shows how Brazil is an isolated case in a number of important dimensions of its political system. Its allocation of public funds to parliamentarians and political parties is much higher than in other countries. Questions. In particular, why are there so many parties in Brazil and why is public spending with each of the parties? And the legislative power is very high,” says Luciano.
matches
Financing the parties also adds up to billions of resources in Brazil. Brazilian political parties received, on average, 446 million US dollars annually (2.2 billion Brazilian reals). Mexico comes in second with $307 million (1.5 billion Brazilian reais). Excluding Brazil, the sample average is a public spending of US$65.4 million (R$323 million) with political parties. “These numbers are so high in Brazil, it seems to me an anomaly,” Luciano says. “It’s a huge transfer of resources to the periphery.”
Another curiosity indicated by the research. Brazil has the largest number of political parties: 15, referring only to parties with parliamentary representation. Second place Belgium with 10 abbreviations. Currently, Brazilian parties receive public funds to cover their expenses.
